
The way hospitals allocate their resources affects how patients receive care and the overall quality of care throughout an entire healthcare system; however, these effects are usually invisible unless there is a problem. There have been studies recently that clearly show efficiency gaps in healthcare systems; for example, some medical facilities operate at only 96.1 percent technical efficiency.
In addition, a decrease in Total Factor Productivity (TFP) was evident between 2018 and 2024; therefore, this may indicate some structural problems in the system that have arisen and are continuing over time, rather than the result of a series of 'one-off' problems.
When you look closer, uneven resource distribution becomes even more apparent. Studies show that equity varies widely across regions of all sizes, driven by geographic and population-based differences. In some provinces, average efficiency scores drop as low as 0.364, highlighting how far certain systems lag behind.
Effective allocation can improve patient outcomes, streamline hiring, lower costs, and stabilize operations. However, striking that balance remains difficult. This article explores the hidden costs of poor resource management and uses research insights to outline more effective approaches to managing healthcare resources.
Resource Optimization in Healthcare Operations
Hospital administrators have a difficult job. Administrators need to allocate hospital resources wisely on limited budgets and provide good-quality services. Hospital leaders cannot view reducing costs and improving quality separately – they must do both simultaneously.
Balancing Cost Efficiency and Care Quality
Mixed results are shown in research that examines the relationship between healthcare cost and quality. Of 61 studies reviewed; 34% were positive and showed higher costs lead to better quality. Thirty percent (30%) of the studies were negative and showed lower costs lead to better quality. Thirty-six percent (36%) of the studies could find no correlation between cost and quality of healthcare.
Effective resource management does not depend on cost of resources but rather the allocation of those resources. Teams that work with their patients to develop a plan of care have been able to achieve a 31.9% decrease in costs per patient and have achieved a 62.5% increase in the quality of care provided.
Flexible Staffing Approach
More healthcare organizations now use flexible staffing models to handle changing patient needs. But there's a catch - staffing plans that aim for average demand often leave units short-handed. This leads to patients staying 1.7% longer in hospitals and an 8.3% higher risk of death. The better option is resilient staffing plans, complemented by platforms like Nursa for healthcare facilities, that meet demand 90% of the time. These plans help reduce hospital stays by 1.2% and cut death risk by 4.5%.
Healthcare networks now use centralized scheduling systems to better manage their resources. Take Mercy's case - they used a gig-model staffing platform that boosted nurse staffing by 20% in two years. They filled 94% of their shifts. On top of that, they saved USD 52 million on premium labor and cut agency costs by 62%.
Labor as a Variable Operational Input
Staff costs take up the biggest chunk of healthcare budgets. The way we assign work makes a big difference to both costs and results. Studies show that in many hospitals, other team members could safely handle 36% of registered nurses' tasks. More research shows that nurses and doctors work best as a team, with their roles complementing each other. The elasticity of substitution ranges from 0 to 0.2.
Production functions and input requirements functions (IRF) help us understand how healthcare inputs relate to outputs. This lets us plan our workforce based on actual service needs. The economic data suggest nurses add more value when they care for sicker patients. This means staffing strategies should look at how sick patients are rather than using the same staffing ratios everywhere.
Inefficiencies in Healthcare Resource Allocation: A Quantitative Overview
The U.S. wastes USD 400-USD 800 billion in its USD 2 trillion healthcare budget due to poor use of resources; these inefficiencies are a major barrier to achieving universal healthcare. Assessing the effectiveness of the U.S. healthcare system, therefore, requires a way to evaluate the efficiency of the system.
-
Three-Stage DEA Model for Technical Efficiency
Standard Data Envelopment Analysis (DEA) models don't handle environmental and random factors very well. These models often show efficiency scores much higher than real values. Researchers now use the three-stage DEA approach to solve this issue.
This method separates external environmental influences to more accurately reflect internal management efficiency. A study in Gansu Province found that healthcare services had a technical efficiency of 0.962 after adjusting for environmental factors.
All regions were identified as efficient, except for three, which were identified as inefficient. The technical efficiency of resource allocation for traditional Chinese medicine hospitals in China varies significantly across regions. However, there are regions achieving maximum Technical Efficiency values. GN City fell behind with an overall Technical Efficiency Value of just 0.610, indicating poor resource utilization.
-
Malmquist Index for Productivity Trends (2018–2024)
Changes in the Malmquist Productivity Index can help track overall trends and efficiency improvements or declines in U.S. Healthcare Systems from 2018 through 2024. This Index tracks both improvements in efficiency and improvements in technology, as well as how these improvements have contributed to an overall increase in Total Factor Productivity (TFP) within U.S. Healthcare Systems over time.
As reported, TFP has been trending downward since 2018. In 2018-2024, the average Malmquist Productivity Index was 0.955. Thus, every year, healthcare productivity is down 4.5%. Technical Change averaged .960 per year. During 2022-2023, technical change peaked at 1.318 and remained under 1.0 in other years. Overall, these results suggest that while there are occasional increases in technology use in healthcare systems, the rate of productivity growth in healthcare systems remains low.
-
Slack Variable Analysis in Underperforming Cities
Slack variable analysis provides a comprehensive picture of resource-use problems in struggling healthcare systems. This analysis shows whether DEA-inefficient cities use their resources (staff, equipment, facilities) and services optimally.
To name just one example, see the study of three inefficient cities. BY and PL optimized three input indicators (S2-, S3-, and S4-). GN managed to optimize only one (S4-). The cities also differed in output optimization. GN reached optimal levels for just one variable (S3+), while BY and PL achieved two. These results highlight specific areas where resource allocation strategies need improvement.
Geographic and Population-Based Inequities in Resource Distribution
Healthcare resources are often unfairly distributed in many regions. These inequities can be demonstrated through the use of various measurement tools that show how resource availability affects the level of quality of patient care in these types of areas.
-
HRAD vs PAD: Measuring Spatial and Demographic Fairness
The Health Resource Agglomeration Degree (HRAD) and the Population Agglomeration Degree (PAD) provide two perspectives of resource equity. When HRAD = 1, it indicates that there is an optimal geographic distribution of healthcare resources. Values for HRAD greater than 1 indicate a higher concentration of healthcare resources relative to the population, while values less than 1 indicate an inequitable distribution of resources relative to the population.
An alternative approach to assessing whether sufficient health care resources are being made available is to use the HRAD/PAD ratio. A ratio of > 1 indicates a surplus of health care resources in relation to population demand; a ratio of < 1 indicates a deficit of health care resources in relation to the population.
-
Disparities in TCM Bed Allocation Across Gansu
The allocation of TCM beds in Gansu Province, as stated by the traditional Chinese medicine (TCM), is highly unequal. The ratio of health resources available/needed (Hrad) was found to be between 0.029 and 5.126 for Gansu, while the population fairness ratios were found to range between 0.219 and 2.065; this indicates that the eastern provinces of China have been given a significantly greater amount of TCM resources.
-
Population-Weighted Resource Gaps in Rural Areas
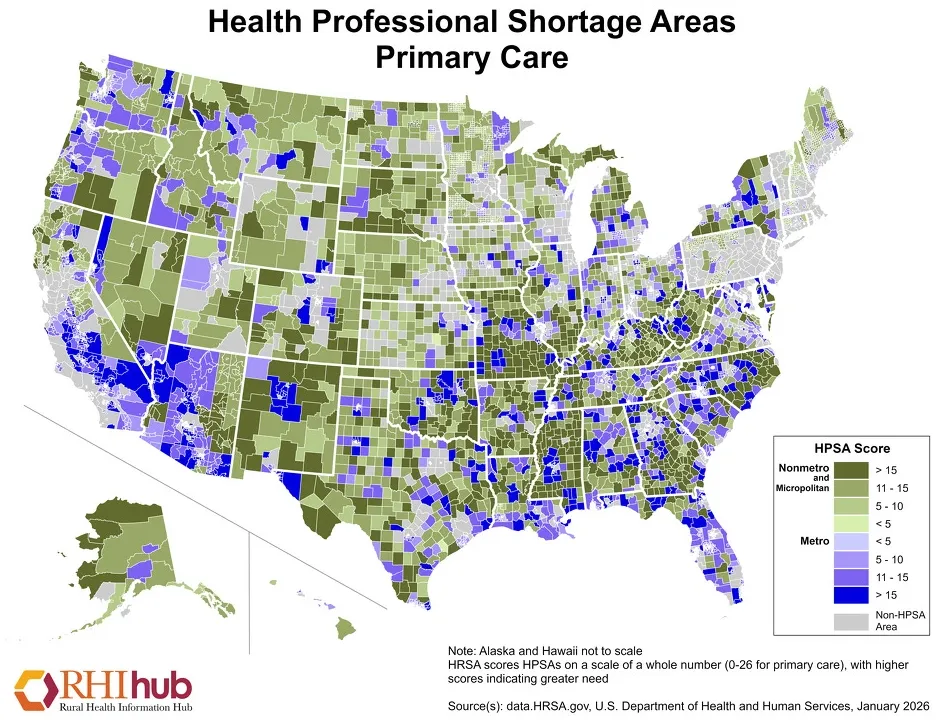
There are many barriers to accessing healthcare in rural communities. Forty-three million rural Americans live in areas with a shortage of primary care physicians. Ninety-two percent of rural counties have too few health professionals. In terms of regional differences, the rural counties in the South and West are experiencing the greatest number of primary care shortages -- 97% of the time.
The Hidden Costs of Poor Allocation: Systemic and Economic Impacts
Healthcare systems lose substantial money and efficiency due to poor resource allocation. Recent studies reveal alarming hidden costs linked to mismanaged resources in healthcare operations.
-
Decline in Total Factor Productivity: 0.955 TFP Index
The total factor productivity (TFP) index has dropped to 0.955, showing a steady decline in healthcare productivity compared to previous years. This concerning metric shows productivity falling by 4.5% each year.
Between 2018 and 2024, the TFP value improved to 1.319 during 2022-2023, while all other periods fell below 1.0. The system hit its lowest point in 2021-2022 with a TFP index of 0.811, highlighting significant room for improvement. Healthcare systems elsewhere show comparable trends, with annual TFP declines ranging from 3.7% to 5.6%.
-
Underutilized Infrastructure and Human Resources
In the U.S., nearly half (47%) of health-care organizations are failing to utilize their data to support effective clinical and business decision-making. Despite recognizing that data analytics has the potential to enhance clinician productivity (95%), only 30% of healthcare organizations have saved money through more efficient resource allocation.
-
Impact on Service Quality and Patient Outcomes
In terms of the impact of resource misallocation on patient care, it is directly related to the quality of care provided. According to estimates, approximately 7% of hospitalized patients in high-income countries develop a hospital-acquired infection.
Conclusion
Healthcare resource allocation now sits at a decisive moment. Ongoing research continues to expose inefficiencies and inequities across healthcare systems worldwide. As shown throughout this article, poor allocation directly affects patient outcomes while productivity declines. Rising spending paired with falling returns signals structural problems that demand coordinated, data-driven responses.
Forward-looking organizations move beyond cost-cutting by balancing staffing, technology, and patient needs. Flexible staffing models, centralized scheduling, and stronger analytics already show measurable gains. By fully using evaluation tools and shared insights, healthcare leaders can improve safety, efficiency, and equity, turning smarter resource management into lasting operational stability.
Disclaimer: This post was provided by a guest contributor. Coherent Market Insights does not endorse any products or services mentioned unless explicitly stated.


